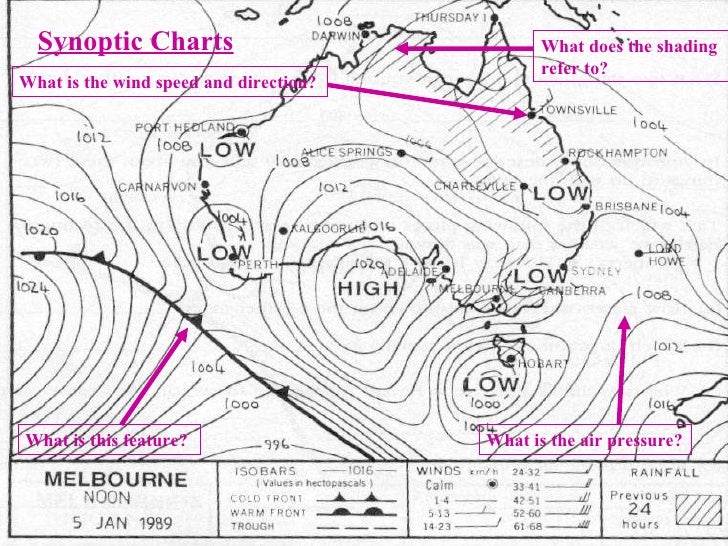
Looking at this picture, I would have never depict that this chart can show the weather. A synoptic chart is the scientific term for a weather map. Synoptic charts provide information on the distribution, movement and patterns of air pressure, rainfall, wind and temperature. This information is conveyed using symbols, which are explained in a legend. Who knew that you can so much information from this chart?

All these elements like temperatures, wind direction, pressure, clouds and precipitation are shown on the synoptic chart. After visiting the Met office in Piarco, I was really interested in becoming a meteorologist because I was interested in all the various equipment to test the various elements of the weather. I found out that I will have to go Barbados for 18 months to do a meteorology degree. I enjoyed this session a lot because I was able to learn so much in a short period of time. I think meteorology is a good field to get in since it is not an easy thing to master. Everyone think forecasting the weather is so simple and easy, they don't know behind the scenes the real drama that these meteorologists have. 
Great post Keisha, but I want you to reflect even deeper and answer the following: How did this lesson/experience help you to understand yourself and others? What biases, stereotypes, preconceptions, and assumptions did you have? How were they changed by this lesson? What changes will you make to ensure your self-learning and self-development in the future?
ReplyDelete